Surveillance DB™: For SAP HANA Database Platform
Essential tools for real-time performance monitoring, issue identification and resolution, rules-based event management, data repository and reporting
Surveillance DB™ for SAP HANA provides best-in-class database monitoring and event management technology to support your in-memory data management environment.
Utilizing real-time monitoring, unattended event management, and historical data analysis tools, IT professionals have the ability to capture comprehensive views of overall health, and perform comprehensive drill-downs to identify and eliminate operational and performance bottlenecks.
EVAL SURVEILLANCE FOR YOURSELF!
Register to gain instant, FREE access to our Web Client Portal
Click on screen to get started...
Key monitoring capabilities for SAP HANA database includes:
- Complete visibility across On Premises, Cloud, and Container Database KPIs and Metrics
Enable secure, global web access to database performance monitoring of HANA databases in any data center. - Access Historical Metrics… even if the HANA Database is Offline
Did a problem occur at 15:00 yesterday? Or last week? Quickly access co-distributed, historical data using Flashback or Time Slicing to find out what was really happening. - Generate Reports for Compliance
Satisfy critical security and privacy requirements with audit reporting – large or small – to track SQL, bad logins and much more.
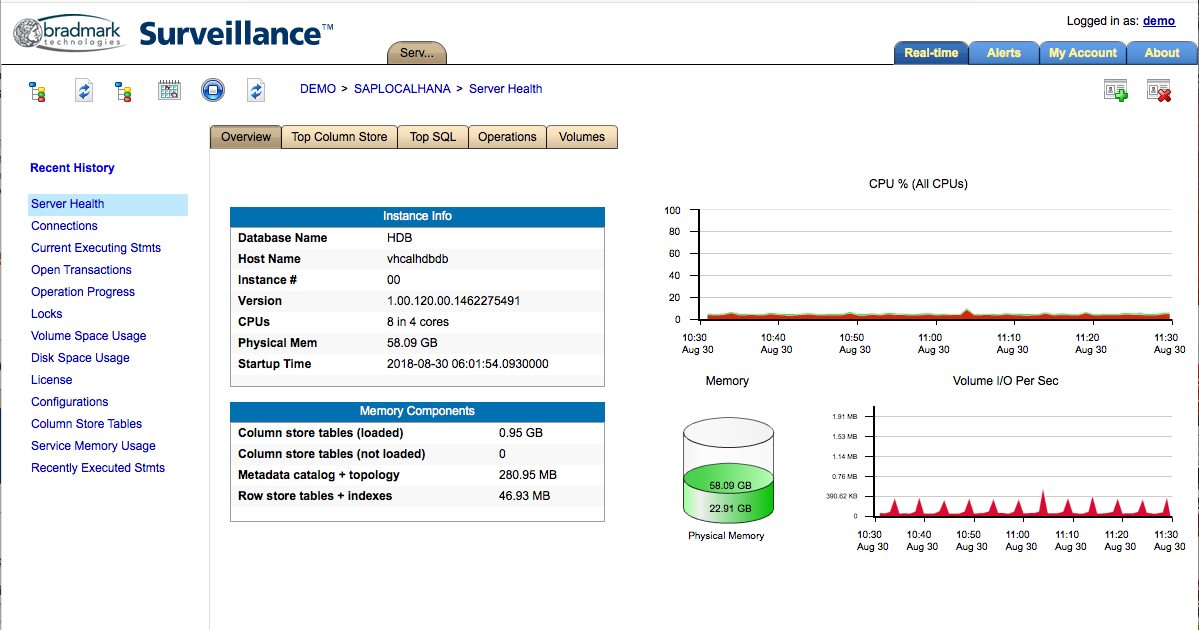
- Health Window providing monitoring of CPU usage (User / System / Wait), volume I/O per second, physical memory usage, memory components (in column store, row store, metadata, etc.), and instance information (name, version, core count, startup time, etc.)
- Top Column Store Tables
- By Actual Memory Usage, Estimated Usage, Delta Usage, or Delta %.
- Status / progress on delta merges and full / partial loads.
- Memory breakdown (main, delta, history main, history delta).
- Currently Running
- Statements with full and easy-to-get SQL and SQL plans.
- Delta merges and loads on column store tables.
- Operations and transactions.
- Space Usage
- Memory (overall, column store tables, service memory).
- Each disk and volume, data vs. log, aggregated over all disks.
- Transactions (log size, redo, undo).
- Connections (network I/O, app tier, login, current SQL and SQL plan, etc.)
- Configuration (default, system, host, tenant)


