
Related Database Monitoring Tools
See the latest product enhancements in
Surveillance 4.7!

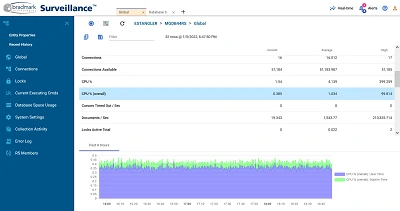
Surveillance™: For MongoDB Performance Monitoring
Essential tools for MongoDB for real-time performance monitoring, historical metrics, issue identification and resolution, rules-based event management, data repository and reporting.
Bradmark Surveillance™ for MongoDB provides best-in-class monitoring and event management technology to support NoSQL database envionments. Utilizing real-time monitoring, unattended event management, and historical data analysis tools, IT professionals have the ability to capture comprehensive views of overall MongoDB health, and perform comprehensive drill-downs to identify and eliminate operational and performance bottlenecks.
Surveillance for MongoDB provides full support for versions 3.6 through 7.0, and key functionality that includes:
- Viewing the overall health of key areas of MongoDB
- Graphing global metrics--such as active sessions, lock queues, memory usage, and much more--over many hours
- Monitoring real-time collection activity, for total query time, IO time, lock time, and much more
- Monitoring currently executing commands, with full command text available
- Finding Top Collection Activity from yesterday or last week, showing query time, IO time, lock time, and much more

- Reviewing Top Commands from a few hours ago or a few weeks ago. Find out what was happening yesterday between 13:00 and 15:00, for example
- Reviewing historical query plans for Top Commands in the past
- Monitoring connections
- Viewing locks
- Monitoring database space usage
- Displaying / searching all settings, or just the changed (non-default) settings
- Terminating commands from the UI
- Setting up alerts on free space, long-running commands, and more