
See Related Core Modules:
See the latest product enhancements in
Surveillance 4.5
Surveillance Real-Time Performance Monitoring
 Monitor Real-Time Statistics Across Multiple RDBMSs
Without reliable monitoring tools, work stoppage will continue until the DBA is notified by the user community or help desk that there is a performance problem. Once available, the DBA has to then write and/or run scripts that query a multitude of performance statistics to determine the cause of the problem before the work stoppage can be eliminated.
Surveillance Real-Time Monitoring displays exactly what is currently happening in the database. Monitor real-time database performance without writing scripts, reducing the need for a large, skilled staff to trace problems. An extensive set of pre-defined windows that are used to immediately display real-time information for up to 2500 detailed performance metrics such as session/process activity, locks, batch contention, file I/O, and much more. Highlighting an entity under the any supported database agent displays a context toolbar at the top of the screen.
A Global window corresponding to the database on that server then displays important statistics regarding the status of the database instance. For quick problem identification, double-clicking on a line in a window deploys an analytical drill-down methodology, allowing a DBA to go deeper or "drill-down" to start a time-line graph for that statistic.
Key Real-Time Monitoring features:
- Immediate visibility of overall database system health and availability
- View multiple datbase types of real-time data from a single UI
- Identify problematic SQL statements
- Robust drill-down capabilities displays detailed metrics such as database space utilization, configuration, running SQL, and much more.
- Customized windows or graphs to refresh at either the default collection interval or its own refresh interval
- Establish baselines for threshold values in Event Management's rule definitions.
Blocking Instance Scenario
If an alert notifies the DBA that a user is blocking other users for an extended period of time – causing a work stoppage, Real-time Diagnostics can be used to identify the user's session that is causing the problem. Drilling down to session details reveals that the user's session has issued an exclusive lock on the LEDGERS table that is preventing other users from entering general ledger records. The DBA is also able to determine that the user has selected data for update purposes, but has neglected to save or abort the update, causing other users to wait.
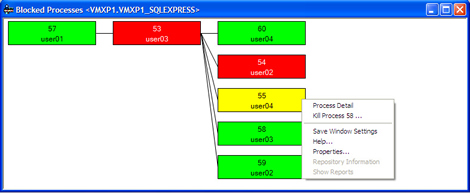
The DBA can then request that the user save or abort the data. If the user can't be found, the DBA could decide to kill the user's session, allowing other users to enter general ledger records. If the DBA is not available, a pre-configured rule in Event Management can kill the session automatically – the work stoppage will be eliminated without intervention from technical professionals.