

Surveillance OS allows
you to monitor the performance of the operating system, applications,
and users on a server. Built upon the mature, reliable Surveillance
DB monitoring architecture, Surveillance OS provides
customizable data gathering, analysis, and alerting features.
In addition to providing detailed operating system statistics, there
are also user-customizable collections to monitor Logfiles, Application
Processes, and Script Execution with analysis of results. Surveillance OS is
specific to Server monitoring. It provides the System Administrator with
the necessary tools for effective and efficient monitoring of multiple
systems simultaneously.
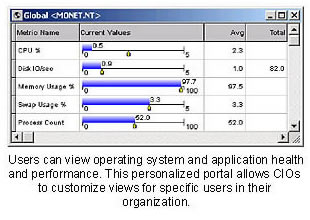
Operating System monitoring
Key resource utilization and operating statistics (e.g.
CPU Utilization, Filesystem Usage, Device IO) can be monitored through
windows in the real-time diagnostics interface, alerted on when thresholds
are met, and stored in a repository for reporting over time.
Heartbeat monitoring
NORAD Surveillance OS uses the Heartbeat-monitoring feature
to report the general availability of all systems being monitored. If
a system goes down, an alert can be generated. The information can be
stored in the repository and used to generate an availability report.
Now you'll know immediately if a database, application or the entire
system goes down.
Implementation of the Surveillance OS Heartbeat
monitoring feature is extremely flexible. In an Surveillance OS server
monitoring arrangement, one or more servers can be setup as a
monitoring station. However, a single monitoring station can
simultaneously oversee an unlimited number of Surveillance OS-equipped
servers.
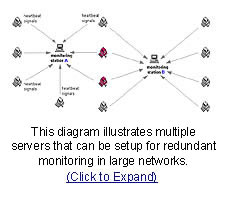 In
a very large network, the monitoring responsibility can be divided
among multiple monitoring stations. Furthermore, the reliability
of the Surveillance OS monitoring service in very large
networks can be further enhanced by means of redundant monitoring.
For example, a server carrying critical importance can be configured
to report its status to one principal monitor and one or more backup
monitors. In
a very large network, the monitoring responsibility can be divided
among multiple monitoring stations. Furthermore, the reliability
of the Surveillance OS monitoring service in very large
networks can be further enhanced by means of redundant monitoring.
For example, a server carrying critical importance can be configured
to report its status to one principal monitor and one or more backup
monitors.
Application
process modeling
Group processes and their resource utilization
together by application. Monitor key processes to ensure
they are running and restart them if they are not.
Back
to top
Script
execution with output parsing
This feature allows the user to specify
scripts (or commands) to execute and then parse data
out of the output as well as any error code. The Script
Execution Monitor provides a mechanism for executing
commands or shell scripts and parsing the resulting
input to monitor for custom situations. For example,
you can execute a ping and monitor whether the ping
was successful. If unsuccessful, create a result status
of ERROR that can generate an alert. Or, you can execute
an ls -l of a specific file, parse the output to determine
the file size and be alerted when the file size exceeds
a specified threshold.
Pre-defined & user-defined
rules
NORAD Surveillance OS provides several pre-defined rule templates
and parameters which can immediately monitor Operating System resources.
Custom thresholds, refresh rates, and other characteristics can be set
when these templates are applied to an entity. Users can also construct
their own rules through the NORAD Surveillance Module graphical user
interface.
Logfile monitoring
The LOGFILE monitoring feature allows you to monitor for
custom situations by providing a mechanism for reading through a text
file and parsing the rows. A Logfile window is provided through the NORAD
Client which will display the results of any Logfile monitor definitions.
The LOGFILE monitor evaluates the logfile for specified search conditions,
and only those lines that meet the terms of the search conditions are
reported. An error code and error text can be parsed out of qualifying
lines and an error level set.
For example, you can monitor the /var/ adm/messages file for the string REPEATED
LOGIN FAILURES, and have an alert notify the System Administrator when
a userÌs attempt to login fails. Or, you can search for su rootÌ failed to
be notified of failed attempts at superuser access.
Application process monitoring
The Application Process Monitor provides a mechanism for monitoring the
execution of a process or group of processes. Users can group OS level
processes by application. You can group all processes owned by a specific
user (e.g., root), and monitor the memory utilization of all combined
processes. Or you can monitor an individual process (e.g., in.named),
and be alerted if the process is no longer running, and execute a script
to restart it. Or you can monitor the number of running processes with
the same name, and generate an alert if too many processes of that name
are running.
Store information in the repository
Surveillance DB provides
a mechanism for storing data collections to a repository for reporting
and analysis. This process begins by defining data stores from
any pre-defined or user-defined collection. Historical data is retained
in named stores, which have user-specified time intervals and duration.
Any ODBC compliant reporting tool can be used to query and/or graph the
historical data. All data collected by NORAD Surveillance OS can
be viewed real-time, have rules applied, generate alerts, perform
actions, and be stored in repositories for subsequent viewing.
Back to
top
|


