|
Surveillance RS monitors
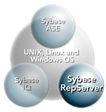
the availability and performance of the Sybase Replication Server
and can be used in conjunction with the ASE and operating system
components to provide a complete view of the system. One window,
with drill-down capability, provides a high-level overview
of reliability and performance metrics such as thread status,
partition
utilization, inbound SQM activity, outbound DSI queues, transaction
exceptions, memory utilization and the status of warm standby
pairs.
Additionally, configuration of the
Replication Server is monitored, including all configuration
parameters stored in the RSSD that
affect operations. The full functionality of Surveillance
RS is available to implement custom rules and alerts for the
organizational and
operational requirements of the business.
In addition
to the Surveillance standard features set (listed
below), the following are specific features provided
for Sybase Replication Server:
| Key
Features/Benefits for Sybase Replication Server |
-
Using out-of-the-box collections,
Surveillance RS provides useful information on Replication
Server Health, Replication Server Statistics, Replication
Server Configuration, Receive Alerts and Alarms that
warn of potential problems
-
Ensure availability
and performance for all components of a Replication
Server
environment
-
Analyze the Replication
Server errorlog and alert DBAs to critical errors
-
Monitor replication
transaction activity
-
Monitor the replication
partition space and alert you before it fills to
capacity
-
Get alerts on exception
transactions so that they can be resolved
in a timely fashion, keeping the databases in
sync.
-
Measure replication latency
and throughput
|
-
Monitor unlimited
servers through its distributed agent architecture
-
Real-time,
proactive monitoring, event-driven alerting and task dispatching
-
“Flashback” to
the recent past and diagnose data to determine the root
cause of an outage.
-
Allow DBAs
to share information between the various agents, minimizing
data retrieval and overhead while maximizing efficiency
on complex networks.
-
Customizable
client user interface that increases a DBA’s effectiveness
to view only the information they need to see.
-
Easy integration
of Surveillance alerts with existing network console systems,
such as Tivoli or OpenView.
-
Easy integration
of existing SQL scripts into Surveillance, through the
user-defined collection (UDC) capability.
-
Produce high
quality reports from the Surveillance Centralized Repository
Database, and generate numerous pre-defined reports for
each monitored platform
Back to top
|